環境資訊中心外電;姜唯 翻譯;林大利 審校;稿源:Carbon Brief
()
報告怎麼看土地沙漠化?
IPCC土地報告將沙漠化定義為「發生在乾旱、半乾旱和乾次濕地區(統稱為乾地)的土地劣化」,由許多因素造成,包括人類活動和氣候自然變化。
因此,報告指出,儘管叫做沙漠化,土地沙漠化不等於「沙漠擴張」,而是「代表發生在乾地的所有形式和程度的土地劣化」。
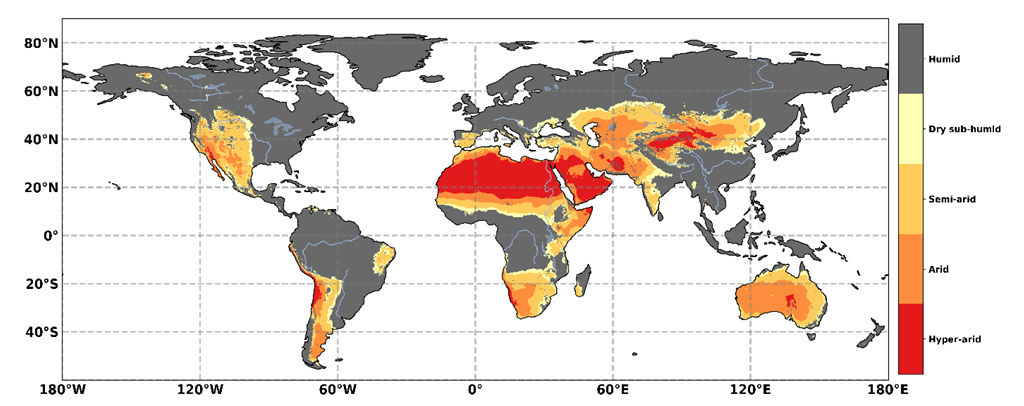
「乾地」一詞包括全世界被定義為乾次濕、半乾旱、乾旱或超乾旱的地區,在下面的IPCC地圖中以黃色、橙色和紅色表示。

乾旱地區的地理分布,以 為基礎。 AI的分類為:潮濕(灰色陰影)AI> 0.65、乾次濕(黃色)0.50 <AI≤0.65、半乾旱(淺橙色)0.20 <AI≤0.50,乾旱(深橙色)0.05 <AI≤ 0.20、超乾旱(紅色)AI <0.05。資料來源:IPCC土地報告,圖3.1。
全球有30億人口住在乾地,約佔全球人口38%。乾地人口最多的是南亞,其次是撒哈拉以南非洲和拉丁美洲。整體而言,乾地上約90%的人口生活在發展中國家。
乾地人口極易受到沙漠化和氣候變遷的影響,因為他們的生計主要依賴農業,而農業是極易受氣候變遷影響的行業。
驅動沙漠化的因素相當程度能反映土地劣化的原因。然而,由於降雨稀少、規律變化以及土壤肥沃度差,乾地特別容易受到土地劣化的影響。
追踪全球沙漠化的範圍和程度是很棘手的工作,因為沒有單一的方法可定義或量化之。估算出的數字也會因缺少資訊和/或不可靠的資訊而大不相同。
評估沙漠化程度主要透過三種方法:專家判斷、植被變化的衛星圖像,以及生物物理模型。這三個方法一起使用能提供相對全面性的評估,但沒有一個足以掌握整個情況。
儘管如此,報告指出,過去幾十年來,部分乾地沙漠化範圍和強度增加了。乾地的暖化趨勢是全球平均水準的兩倍。由於乾旱頻率增加導致生長季節土壤水分減少,部分溫帶乾地將轉變為亞熱帶乾地。
報告相當肯定,沙漠化的風險將因氣候變遷而增加。例如,在全球暖化1.5°C、2°C和3°C的「共享社會經濟途徑SSP2」(「中間路線」)下,生活在乾地並面臨缺水壓力、乾旱強度和棲息地劣化等風險的人口分別將達到9.51億、11.5億和12.9億人。
編按:共享社會經濟途徑(Shared Socioeconomic Pathways,SSPs)是IPCC近期所研發的社會經濟情境描述方式,描述五種未來世界在人口、經濟增長、能源需求、社會平等和其他因素方面的差異情境,分別以SSP1~SSP5描述。 。
報告稱,全球暖化將減少乾地作物產量,可能會減少當地的糧食和飼料產量。如果農業生產力沒有提高,食物浪費和損失沒有減少,要滿足不斷增長的糧食需求可能需要將農田擴大到更邊緣的地區。
乾地土壤侵蝕的主因是農田擴張,這可能進一步導致沙漠化。農業生產力下降、糧食價格變化加上極端天氣事件增加可能會加劇部分旱地人口的貧困狀況。「撒哈拉以南非洲和南亞乾地的貧困現象越來越集中,總人口中分別有41%和12%生活在極度貧困中。」
氣候變遷也可能在某些地區刺激遷移。雖然人口外移民短期內可減輕土地壓力,但由於農村勞動力供應減少和/或農村工資增加,可能增加勞動密集型永續土地管理的成本。
與其他形式的劣化一樣,沙漠化會影響氣候變遷,也會受到氣候變遷的影響。下圖總結了其中部分的反饋關係,紅色箭頭表示正面效果,藍色表示負面效果。
例如,植被的減少(圖中間下方)可能使土壤更容易被侵蝕,增加沙塵暴的可能性(右上)。報告稱,這種沙塵的影響會降低當地(從右到左)降水量,進一步加劇沙漠化。

沙漠化影響氣候的主要途徑的。注意:箭頭的顏色表示正(紅色)或負(藍色)效果,或兩者(黑色)。實線箭頭是直接效果,虛線箭頭是間接效果。資料來源:IPCC土地報告,圖3.8。
報告還詳細介紹了一系列「熱點」,以提供沙漠化相關經驗和教訓。這些案例研究包括透過綠牆、入侵植物物種、超乾旱地區的綠洲和流域綜合管理探討土壤侵蝕、植樹造林和森林復育的五個主題。
其中一個案例是撒哈拉大綠牆和薩赫勒倡議。該計畫目的是透過造林和相關計畫,恢復從大西洋沿岸塞內加爾到紅海沿岸厄利垂亞劣化的乾旱地景,減少生物多樣性的喪失並支持當地社群。
然而,雖然部分國家正在實行該倡議,報告警告,如果沒有大量額外資金挹注,很可能難以達成目標。
氣候變遷導致的土地劣化有哪些更廣泛的影響?
,土地劣化已經對全世界人口的生計產生影響,尤其是生活在脆弱和貧困地區的人們。
然而,作者在中明確指出,很難確定氣候變遷在其中扮演的角色:「確立氣候相關的土地劣化對貧困和生計的影響非常不容易,因為牽涉多種社會、政治、文化和經濟因素的相互作用,例如市場、技術、不平等、人口增長,每種因素都與社會生態系統的反應方式相互作用,也形塑著社會生態系統。」
在審視這些問題時,很難將氣候與其他土地劣化因素隔離開來。這個領域的大多數研究都探討了小農的生計問題。由於土壤和降雨變化,人們普遍猜測貧困與氣候變遷之間存在某種潛在關聯,但目前尚缺乏證據。
此外,雖然有研究估計世界上超過2/5的窮人生活在土地劣化地區,但這些資料信度不足,需要更多研究。
報告也指出,氣候變遷經常被視為土地劣化和貧困的風險乘數。此外,報告同意在全世界多個貧窮地區,貧困、土地劣化以及面對與氣候變遷相關極端氣候事件的脆弱性都是相輔相成的。
SPM指出,消除貧困與因應氣候變遷、沙漠化、土地劣化和糧食安全之間存在綜合效應。
更具爭議的是氣候相關土地劣化與遷移和衝突之間的關係。當人們因環境變化而陷入貧困或被剝奪生計時,一種適應方式是遷移到另一個地區,可能是境內或境外。理論上這可能增加遷入地的壓力。例如,研究顯示,與氣候有關的災害可能是導致暴力衝突的一個因素。
雖然氣候引起的遷移與衝突和土地劣化之間的關係還需要更多證據,但SPM指出:「氣候變遷會放大環境導致的境內與跨境遷移,反映遷移有多重因素,也有其適應措施。極端天氣和氣候或緩慢發生的事件可能導致遷移、食物鏈中斷、生計受威脅,並加劇衝突壓力。」
報告舉了一些類似案例。例如,在瓜地馬拉和肯亞,一般認為土壤品質下降是人民往遠方遷徙以尋找收入的主因。
同時,部分學者認為盧安達和蘇丹的衝突與土地劣化有關,也有學者認為氣候變遷是武裝衝突的「弱預測因素」。因此,報告認為這個問題相當程度上尚無定論:「探討氣候變遷-土地劣化主因之一-與衝突的關係的研究有許多相左的結果,而且氣候變遷導致的土地劣化究竟是導致衝突還合作仍然不明。」

報告認為,氣候變遷導致的土地劣化究竟是導致衝突還合作仍然不明。
氣候變遷如何影響糧食安全?
報告的另一個重點是氣候變遷對糧食的影響。SPM表示,氣候變遷已經影響了全世界許多地區的糧食安全。報告說,暖化會直接影響作物生產,進而影響糧食供應。
「可觀察到的氣候變遷已經透過暖化改變降水模式以及更頻繁的極端氣候事件影響糧食安全。氣溫升高正影響高緯度地區的農業生產力,提高了部分作物(玉米、棉花、小麥、甜菜)的產量,而低緯度地區部分作物(玉米、小麥、大麥)的產量則正在下降。
氣候變遷對作物產量的影響因地而異。
在亞洲,包括中國北方等地區,暖化和農業創新等因素導致水稻產量增加。同時,以印度為主的作物產量研究發現,1981年到2009年,暖化使小麥產量減少了5.2%。
近年整個非洲大陸的主要作物如玉米、小麥、高粱和水果的產量都有所下降。喀麥隆的撒哈拉地區營養不良現象日益嚴重,部分原因是氣候變遷,惡劣的氣候條件導致極度乾旱,影響農業生產。
聖嬰現象等氣候自然變化也可能對糧食供應產生深遠影響。發生在2015年末至2016年初的強烈聖嬰現象導致撒哈拉地區區域性降水變化。衣索比亞嚴重乾旱,大面積的作物歉收,超過1000萬人需要糧食援助。

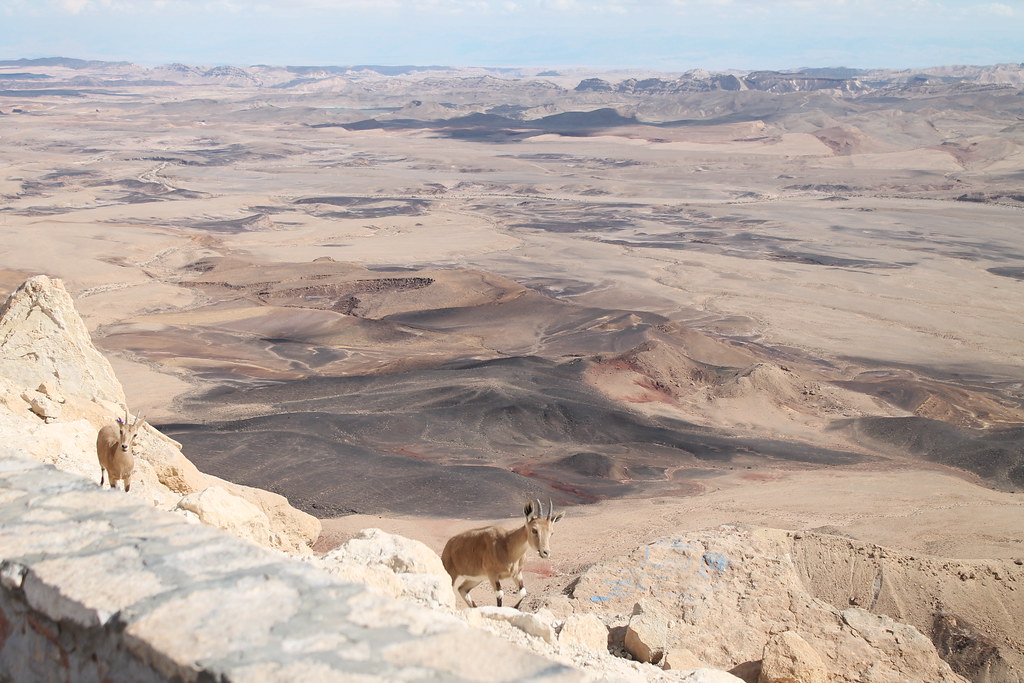
薩赫爾地區的乾地,此處位於非洲北部撒哈拉沙漠和中部蘇丹草原地區之間。 (CC BY-NC-ND 2.0)
報告稱,氣候變遷對糧食產量的影響將在未來幾十年內惡化。
以下地圖摘自第五章第27頁,顯示在嚴重的氣候變遷情境下(RCP8.5,即各國未減碳、CO2濃度達1370ppm的高排放情境),2070~2099年間預期產量與1980~2010年的比較。圖上顯示玉米、小麥、大豆和稻米的變化。在圖中,紅色顯示產量下降50%,而藍色顯示增加50%。
值得注意的是,此預測納入了二氧化碳施肥效應和氮含量壓力的潛在影響。
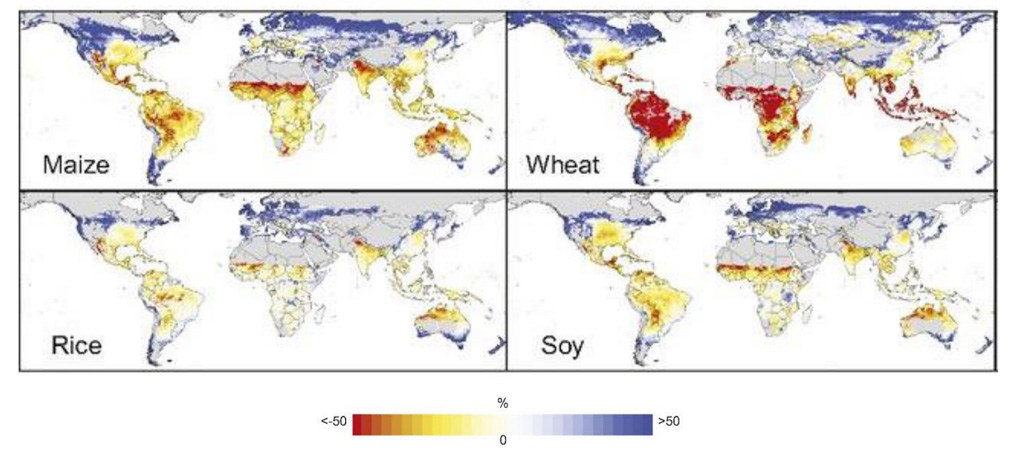
在嚴重氣候變遷情境(RCP8.5)下,2070~2099年間,玉米、小麥、水稻和大豆產量中位數與1980~2010年的比較。紅色表示產量下降50%,藍色表示增加50%,灰色表示未種植作物的區域。資料來源:IPCC土地報告,圖5.4。
該地圖顯示,如果未來氣候變遷非常嚴重,南美洲和撒哈拉以南非洲部分地區可能會發生嚴重的小麥減產。
除了影響產量外,氣候變遷還可能改變糧食品質。SPM指出,大氣中二氧化碳濃度升高會降低作物的營養成分。報告稱,可能受二氧化碳含量上升影響的營養成分包括蛋白質和鋅。
氣候變遷影響糧食的另一種方式是增加病蟲害。報告發現,有有力證據可證實氣候變遷已經影響了病蟲害的發生。
未來的氣候變遷也可能影響畜牧業生產。沙漠化可能影響牛隻的飼養,熱浪的增加可能直接影響動物的發病率、死亡率和痛苦。
報告稱,糧食供應的變化可能透過改變食品價格影響糧食取得和穩定性。
由於氣候變遷,2050年穀物價格可能會上漲1-29%,導致糧食價格上漲、糧食危機和飢餓風險增加。糧食價格上漲尤其威脅著全世界的窮人。「減產會透過減少高營養作物供應和適應性行為來影響窮人的營養攝取,適應性行為指的是改吃韌性較強但是營養價值較低的糧食……在富裕國家,貧窮通常與高熱量但低營養成分有關,如不良飲食、肥胖、過重和其他相關疾病。」

成都的稻田。 (CC BY-NC-ND 2.0)
社會經濟變化對未來土地劣化有多大影響?
報告強調,世界各地的社會經濟變化會決定地球的未來,且預測往往顯示,社經變化對土地利用模式的影響大於氣候變遷。
氣候變遷不僅導致氣溫上升,還會影響人類的消費模式、土地管理和人口變化。SPM中簡要描述:「對糧食、飼料和水的需求增加、資源密集型消費和生產需求增加、農業產量技術進步有限的途徑,導致乾地水資源短缺、土地劣化和糧食不安全的風險增加。」
這裡的「途徑」指的是IPCC報告中的「共享社會經濟途徑」(SSPs),用來瞭解全球社會、人口統計學和經濟學的變化將如何與氣候變遷相互作用。
SSP共有五個,土地報告主要關注前三個,每個都提供了截然不同的結果。(去年明每種情境的含義;也可參閱台大風險社會與政策研究中心)
SSP1的特點是人口增長率低,本世紀末地球上只有70億人口。高收入,整體不平等減少,有效率的土地利用,以及較少的肉類消費和糧食浪費。
SSP2是過去消費和技術進步趨勢的延續,中等人口增長,2100年達到90億。
SSP3的人口幾乎是SSP1的兩倍,2100年為130億。此途徑的特點是低收入、資源密集型消費模式、貿易壁壘和技術變革速度緩慢。
這三個社經途徑以及相對的人口變化、消費模式和其他因素的變化,對未來的土地使用方式差異很大。
下圖顯示21世紀地球表面用於森林(藍線和陰影區域)、生質能源作物(紫色)、自然土地(紅色)、農田(黃色)、牧場(綠色)與2010年相比的增加(正數)和減少(負數)。
從左到右,每個圖表顯示本世紀末暖化限制在1.5C的情況下土地利用將如何變化。最左邊的圖表顯示了SSP1,中間是SSP2,右側是SSP5(資源密集、依賴化石燃料的途徑)。
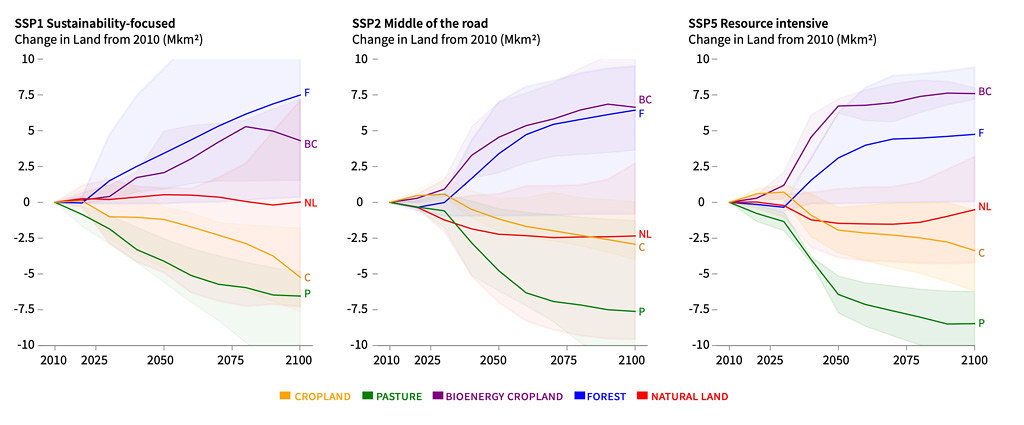
升溫1.5°C的情況下,與2010年相比,用於耕地(黃色)、牧場(綠色)、生質能作物(紫色)、森林(藍色)和自然土地(紅色)的變化。左:SSP1。中間:SSP2,右:SSP5。資料來源:IPCC土地報告,SPM4A圖。
不同社經途徑下不同的土地利用優先順序變化,將反過來影響溫度上升導致的風險。
下圖顯示SSP1和SSP35這兩種截然不同的途徑,會如何影響與氣候相關的風險。
例如,即使氣溫上升至3°C(依照目前世界各國自主減排承諾落實狀況,將會升溫3°C),SSP1也只會帶來「中等風險」的沙漠化(下圖中最左邊一欄)。
相反地,在SSP3情境下,沙漠化的風險在升溫1.2°C至1.5°C之間就變成「高」,在3°C之下接近「非常高」(左起第二個)。與土地劣化有關的其他風險也是類似的趨勢,例如火災和沿海洪水。

不同社經途徑(SSP1和SSP3)如何影響氣候相關風險。顏色代表影響/風險水準,紫色表示「非常高」的風險和「顯著的不可逆性」,氣候相關的危害和有限的適應能力,白色表示沒有可偵測到和可歸因於氣候變遷的影響。字母表示調查結果的信心水準(「L」代表低,「M」代表中等,「H」代表高)。資料來源:IPCC土地報告,圖SPM.2B。
作物產量變化和糧食供給危機已經被歸因於氣候變遷,但這些風險再次受到某些社經情境的影響。
一項研究估計,SSP1之下,升溫2.5°C時,將有1億人面臨氣候相關飢餓風險,而SSP3之下,升溫3°C時,將使超過8億人受影響。
作者的結論是,必須「以整體性的方式」解決貧困、土地劣化和排放的惡性循環,以產生如SSP1的永續發展,並避免最壞的後果。(系列專文2/3,)
In-depth Q&A: The IPCC’s special report on climate change and land (2/3) by Carbon Brief
What does the report say about desertification?
The IPCC land report defines desertification as “land degradation in arid, semi-arid, and dry sub-humid areas, collectively known as drylands, resulting from many factors, including human activities and climatic variations”.
Therefore, despite its name, desertification is not “equated to desert expansion”, the report notes, but “represents all forms and levels of land degradation occurring in drylands”.
The term “drylands” encompasses parts of the world that are defined as dry sub-humid, semi-arid, arid or hyper-arid – indicated by the yellow, orange and red shading in the IPCC map below.
(For a detailed primer on desertification, published an explainer earlier this week.)
Geographical distribution of drylands, based on the (AI). The classification of AI is: Humid (grey shading) AI > 0.65, dry sub-humid (yellow) 0.50 < AI ≤ 0.65, semi-arid (light orange) 0.20 < AI ≤ 0.50, arid (dark orange) 0.05 < AI ≤ 0.20, and hyper-arid (red) AI < 0.05. Source: Figure 3.1 from the .
Drylands are home to approximately 38% of the global population, the report says – around three billion people. The largest number of people living in drylands are found in South Asia, followed by sub-Saharan Africa and Latin America. Overall, “about 90% of the population in drylands live in developing countries”, the report notes.
Dryland populations are “highly vulnerable to desertification and climate change”, the report notes, because their livelihoods “are predominantly dependent on agriculture; one of the sectors most susceptible to climate change”.
The drivers of desertification mirror those of land degradation more widely – – however, drylands are particularly vulnerable to land degradation because of scarce and variable rainfall as well as poor soil fertility.
Tracking the global extent and severity of desertification is particularly tricky because there is no single way to define or quantify it. Estimates also tend to “vary greatly due to missing and/or unreliable information”, the report says.
There are three main three methods of assessing the extent of desertification – expert judgement, satellite images of vegetation change and biophysical models. Together they “provide a relatively holistic assessment”, the report says, “but none on its own captures the whole picture”.
Nonetheless, “there is high confidence that the range and intensity of desertification has increased in some dryland areas over the past several decades”, the report says. “Warming trends over drylands are twice the global average,” it adds, and “some temperate drylands are projected to convert to subtropical drylands as a result of an increased drought frequency causing reduced soil moisture availability in the growing season”.
The report also has “high confidence” that “risks from desertification are projected to increase due to climate change”. For example, under the (“Middle of the Road”) at 1.5C, 2C and 3C of global warming, the population living in drylands and exposed to risks such as water stress, drought intensity and habitat degradation is projected to reach 951 million, 1.15 billion and 1.29 billion people, respectively.
Global warming “is projected to reduce crop yields across dryland areas, potentially reducing local production of food and feed”, the report says. Without concomitant increases in agricultural productivity and reductions in food waste and loss, meeting growing food demand will thus likely require expansion of farmland into ever-more marginal areas.
As a primary driver of soil erosion in drylands is cropland expansion, this risks further contributing to desertification, the report warns. It adds that the combination of agricultural productivity declines, changes in food prices and increases in extreme weather events is likely to exacerbate poverty for some dryland populations.
“There is an increasing concentration of poverty in the dryland areas of sub-Saharan Africa and South Asia,” the report notes, “where 41% and 12% of the total populations live in extreme poverty, respectively.”
Climate change is also likely to “provide an added incentive ” in some places, the report says. And while outward migration could reduce pressure on the land in the short-term, “this can increase the costs of labour-intensive SLM [sustainable land management] practices due to lower availability of rural agricultural labour and/or higher rural wages”.
As with other forms of degradation, desertification can both influence climate change and be influenced by it. The figure below summarises some of these feedbacks, with positive effects shown by red arrows and negative effects by blue.
For example, a decline in vegetation (below centre in the figure) can leave the soil more at risk of erosion, increasing the likelihood of sand and dust storms (top right). The effects of this dust “would tend to decrease precipitation” in the local climate (top, right to left), the report says, thus further reinforcing desertification.
Illustration of the main pathways through which desertification can feedback on climate. Note: The colour of the arrows indicate a positive (red) or negative (blue) effect, or both (black). Solid arrows are direct while dashed arrows are indirect. Source: Figure 3.8 from the .
The report also details a series of “hotspots” to “present rich experiences and lessons learnt” on desertification. These case studies cover the five topics of soil erosion, afforestation and reforestation through “green walls”, invasive plant species, oases in hyper-arid areas, and integrated watershed management.
One example given is the . This project aims to “restore Africa’s degraded arid landscapes, reduce the loss of biodiversity and support local communities” through “establishing plantations and neighbouring projects…from Senegal on the Atlantic coast to Eritrea on the Red Sea coast”.
However, although the initiative is underway in several countries, “the achievement of the planned targets is questionable and challenging without significant additional funding”, the report warns.
What are the wider impacts of climate change-driven land degradation?
Research land degradation is already having an impact on the livelihoods of people around the world, particularly those living in vulnerable and poverty-stricken regions.
However, in the authors are clear that it is difficult to identify the fingerprints of climate change in these processes:
“Unravelling the impacts of climate-related land degradation on poverty and livelihoods is highly challenging. This complexity is due to the interplay of multiple social, political, cultural, and economic factors, such as markets, technology, inequality, population growth, each of which interact and shape the ways in which social-ecological systems respond.”
When examining these issues, the report says it has been difficult to isolate climate as a factor from other drivers of land degradation.
Most studies in this area have examined livelihoods of small-scale farmers, and while there is widespread speculation about “potential links” between poverty and climate change due to changes in soil and rainfall, the evidence is currently lacking, it says.
Furthermore, while one study estimated that more than two-fifths of the world’s poor live in degraded areas, the report says there is “low confidence” in such figures and notes a need for more research in this area.
However, the report also states that climate change is “frequently noted as a risk multiplier” for both land degradation and poverty. In addition, it acknowledges that in many of the poorest parts of the world, poverty, land degradation and vulnerability to extreme events linked to climate change all go hand-in-hand.
The SPM notes there are “synergies” between poverty eradication and efforts to tackle climate change, , land degradation and food security.
More contentious is the link between climate-related land degradation and migration and . When people are pushed into poverty or have their livelihoods stripped as a result of changes in their environment, one adaptation option is to move to another area – this can be internally or across borders. In theory, this can then . , for example, that climate-related disasters can be a contributing factor to violent conflict.
While the authors note there is still a need for more evidence about the links between climate-induced migration and conflict due to land degradation, the SPM states:
“Changes in climate can amplify environmentally induced migration both within countries and across borders, reflecting multiple drivers of mobility and available adaptation measures. Extreme weather and climate or slow-onset events may lead to increased displacement, disrupted food chains, threatened livelihoods, and contribute to exacerbated stresses for conflict.”
The main report cites a handful of examples of such processes. For example, in and , declining soil quality has been widely cited as a driver behind migrants heading farther afield to generate income.
Meanwhile, conflicts in both and have been linked by some scholars to land degradation, whereas others have found climate change is a “weak predictor” for armed conflict. As such, the report finds that the evidence from this area is largely inconclusive:
“Studies addressing possible linkages between climate change – a key driver of land degradation – and the risks of conflict have yielded contradictory results and it remains largely unclear whether land degradation resulting from climate change leads to conflict or cooperation.”
How can climate change affect food security?
Another major focus point in the report is the ways in which climate change can affect food.
Climate change has “already affected food security” in many world regions, the SPM says.
Warming is affecting food availability by having a direct impact on crop production, says of the report:
“Observed climate change is already affecting food security through increasing temperatures, changing precipitation patterns, and greater frequency of some extreme events. Increasing temperatures are affecting agricultural productivity in higher latitudes, raising yields of some crops (maize, cotton, wheat, sugar beets), while yields of others (maize, wheat, barley) are declining in lower-latitude regions.”
The current impact of climate change on crop yields varies from region to region, the report notes.
In Asia, some parts, including northern China, have seen rice yield increases as a result of regional warming and other factors, such as agricultural innovation, the report says. Crop yield studies focusing on India, meanwhile, have found that warming cut wheat yields by 5.2% from 1981 to 2009, the report says.
In Africa, yields of staple crops such as maize, wheat, sorghum and fruit, including mangoes, have decreased across the continent “in recent years”, the report says. “The Sahel region of Cameroon has experienced an increasing level of malnutrition, partly due to the impact of climate change since harsh climatic conditions leading to extreme drought have a negative influence on agriculture.”
(To read more about how climate change impacts food around the world, read Carbon Brief’s recent on how traditional dishes could fare if temperatures rise.)
Climate variability can also have a “profound” impact on food availability through phenomena such as El Niño, notes .
For example, this “occurred during late 2015 to early 2016 when a strong El Niño contributed to regional shifts in precipitation in the Sahel region,” the report says. “Significant drought across Ethiopia resulted in widespread crop failure and more than 10 million people in Ethiopia required food aid.”
The impact of climate change on food yields is expected to worsen in coming decades, the report says.
The maps below, taken from page 27 of , shows median yield changes expected in 2070-99, when compared yields from 1980-2010, under a severe climate change scenario (“”). Changes are shown for maize, wheat, soy and rice. On the chart, red shows yield declines of up to 50% while blue shows increases of up to 50%.
It is worth noting that the projections consider the potential impacts of the CO2 fertilisation effect and nitrogen availability stress (both explained in more detail above).
Median yield changes expected for maize, wheat, rice and soy in 2070-99, when compared with yields from 1980-2010, under a severe climate change scenario (RCP8.5). Red shows yield declines of up to 50% while blue shows increases of up to 50%. Grey shows areas where crops are not grown. Source: Figure 5.4 from the .
The map indicates that severe wheat losses could occur in South America and parts of sub-Saharan Africa if future climate change is very high.
As well as affecting yields, climate change could alter food quality, the SPM notes: “Increased atmospheric CO2 levels can lower the of crops.” Nutrients that could be affected by rising CO2 include protein and zinc, the report says.
Another way that climate change affects food is through boosting pests and diseases. The report finds “robust evidence that pests and diseases have already responded to climate change”. It says:
“There is some evidence that exposure will, on average, increase, although there are a few examples where changing stresses may limit the range of a vector [disease carrier].”
Future climate change could also affect livestock production, the report notes. could affect rangelands where cattle are reared, the report says, while increases in heatwaves could have a “direct impact on animal morbidity, mortality and distress”.
Changes to food availability could in turn have an impact on food access and stability via changes to food prices, the report says.
Cereal prices could increase by 1-29% by 2050 as a result of climate change, the SPM says, “leading to higher food prices and increased risk of food insecurity and hunger”.
Higher food prices particularly threaten the world’s poor, the report notes:
“Decreased yields can impact nutrient intake of the poor by decreasing supplies of highly nutritious crops and by promoting adaptive behaviours that may substitute crops that are resilient but less nutritious…In the developed world, poverty is more typically associated with calorifically-dense but nutrient-poor diets, obesity, overweight, and other related diseases.”
The report emphasises that access to food is also highly linked to other land issues, such as desertification, degradation and water availability. To learn more about how these issues are interconnected, read Carbon Brief’s recent guest post on the “”.
How important are socioeconomic changes for future land degradation?
The report emphasises the role that socioeconomic changes around the world will have in determining the planet’s future, noting that projections often show these shifts having a larger impact on land use patterns than climate change itself.
The harm generated by the changing climate will not only result from rising temperatures, but also on how humanity’s consumption patterns, land management and populations shift alongside it, the report says. This is outlined concisely in the SPM:
“Pathways with higher demand for food, feed, and water, more resource intensive consumption and production, and more limited technological improvements in agriculture yields result in higher risks from water scarcity in drylands, land degradation, and food insecurity.”
The “pathways” it refers to are a standard set of “” (SSPs), which are used across the IPCC’s reports to give a sense of how changes in global society, demographics and economics will interact with climate change.
While there are five SSPs in total, the land report mainly focuses on the first three, with each one offering significantly different outcomes. A from last year outlines what each of these scenarios means in more detail.
SSP1 is characterised by low population growth, with just seven billion people on the planet by the end of the century. High incomes, reduced overall inequalities and effective land use regulations are also features of this scenario, as well as less meat consumption and food waste.
Based on a continuation of past trends in consumption and technological progress, SSP2 results in medium population growth, hitting nine billion by 2100.
SSP3 meanwhile sees population nearly double that of SSP1, at 13 billion in 2100. This pathway is characterised by low incomes, resource-intensive consumption patterns, barriers to trade and a slow rate of technological change.
Which of these socioeconomic pathways is followed – and the changes in population, consumption patterns and other factors that result – has a large impact on the way land will be used in future, the report says.
The figure below shows how much more (positive numbers) or less (negative numbers) of the Earth’s surface would be devoted to forest (blue line and shaded area), bioenergy crops (purple), “natural land” (red), cropland (yellow) or pasture (green) through the 21st century, compared with the levels in 2010.
From left to right, each chart shows how land use will change in scenarios limiting warming to 1.5C by the end of the century. The left-most chart shows this for SSP1, with SSP2 in the centre and SSP5 on the right (this is a , fossil-fuel dependent pathway).
Changes, relative to 2010, in the area of land devoted to cropland (yellow), pasture (green), bioenergy crops (purple), forest (blue) and “natural land” (red) in scenarios limiting warming to 1.5C above pre-industrial temperatures. Left: SSP1. Centre: SSP2. Right: SSP5. Source: Figure SPM4A from the .
These changing priorities for land use under each different socioeconomic pathway are expected, in turn, to influence how strongly rising temperatures increase risks, the report says.
These influences are illustrated in the figure below, which shows how two very different pathways – SSP1 and SSP3 – will affect climate-related risk.
For example, SSP1 carries only a “moderate risk” of desertification (leftmost column in the chart below) even if temperatures rise as high as 3C. (This is the increase the world is for given nations’ existing climate commitments.)
In contrast, under the SSP3 scenario, the risk of desertification becomes “high” at between 1.2C and 1.5C of warming, and approaches “very high” below 3C (second from left). There is a similar trend for other risks relating to land degradation, such as fires and coastal flooding.
Figure showing how different socioeconomic pathways (SSP1 and SSP3) will affect climate-related risks. The colours represent levels of impact/risk, with purple meaning very high risks and the presence of “significant irreversibility”, climate-related hazards and limited ability to adapt, and white indicating no impacts that are detectable and attributable to climate change. Letters represent the level of confidence in the findings (with “L” representing low, “M” representing medium and “H” representing high). Source: , Figure SPM. 2b.
The report notes that the greatest number of relevant SSP studies to date consider how food security will be affected as temperatures rise.
Changes in crop yields and accompanying threats to the food supply been attributed to climate change, but again these risks are exacerbated by certain socioeconomic scenarios, it says.
estimated that SSP1 would see 100 million people at risk of climate-related hunger beyond 2.5C, while SSP3 would leave over 800 million people vulnerable by 3C.
The authors conclude that addressing cycles of poverty, land degradation and emissions “in a holistic manner” will be necessary to produce sustainable development of the kind exemplified by SSP1 and to avoid the worst outcomes.
For more information, Table 6.2 in of the report outlines the key challenges faced under different SSPs – including SSP4 and SSP5 – for outcomes including climate change adaptation and mitigation, land degradation and food insecurity.
※ 全文及圖片詳見:()
作者
如果有一件事是重要的,如果能為孩子實現一個願望,那就是人類與大自然和諧共存。
於特有生物研究保育中心服務,小鳥和棲地是主要的研究對象。是龜毛的讀者,認為龜毛是探索世界的美德。
本站聲明:網站內容來源再生能源資訊網https://e-info.org.tw/,如有侵權請聯繫我們,我們將及時處理本站聲明:網站內容來源再生能源資訊網https://e-info.org.tw/,如有侵權請聯繫我們,我們將及時處理【健康飲水問題小常識】
※飲水機設備有哪些?
※如何正確使用開飲機?
※飲水機品牌迷思?? 有牌代表最好,錯! 必須先了解用途才能買對開水機!
※何謂電解水飲水機、全自動飲水機 ? 與一般飲水機差異在哪?