政府間氣候變遷專門委員會(IPCC)8日上午在日內瓦發表了氣候變遷和土地特別報告。報告指出,土地提供「糧食、飼料、纖維、燃料和淡水」,沒有土地,人類社會和經濟就「無法存在」。報告警告,全球氣溫上升和近幾十年來前所未有的土地和淡水開採率正威脅這個供給關係。
報告的完整標題說明了其中涵蓋的相互關聯和重疊的各個問題,包括「氣候變遷、沙漠化、土地劣化、永續土地管理、糧食安全和陸域生態系統中的溫室氣體。
在本篇問答中,Carbon Brief解讀報告對氣候變遷與土地如何互相影響的說明,以及其他關鍵主題,如糧食安全、負排放和如何因應土地利用相關的各種相互重疊的挑戰。
為什麼IPCC要發表這份報告?
IPCC的土地報告在瑞士日內瓦進行為期一週的全體批准會議後公佈。在本次會議上,政府代表花一個晚上馬拉松式逐行批准了65頁的「決策者摘要」(summary for policymakers,SPM)報告。SPM達成共識後,IPCC也發表了完整的技術報告,將近1,400頁,另外還有補充文件。(SPM批准後,完整報告需要更新,以確保其與修訂後的SPM一致。這個部分尚未完成,因此各章節還可能會根據修訂紀錄文件來更新。)
這份土地報告最初是由IPCC在2016年4月奈洛比會議上委託編寫。報告的綱要草案隨後於2017年3月在墨西哥瓜達拉哈拉會議上通過。
2017年7月選出的作者團隊包括主要通訊作者、主要作者和編審,由來自52個國家的107位專家組成。每章都有數十位撰稿人支援。
8日上午的記者會上,IPCC主席Hoesung Lee說明了報告的整體調查結果:「土地是我們生活的地方。土地面臨越來越大的人類壓力,也是解決方案的一部分,但土地無法滿足一切。 」
土地報告是IPCC今年發表的第一份特別報告。第二份關於海洋和冰圈的報告將於今年9月發表。去年10月IPCC發表了關於暖化1.5°C的特別報告。
這些特別報告的目的是提供「對特定問題的評估」,補充IPCC每五到六年發表的「主要評估報告」。
新報告是IPCC繼2000年土地利用、土地利用變化和林業特別報告以來,第一份以土地為主題的報告。
完整報告的第四章列出了「土地」的定義:「生物圈的陸地部分,包括自然資源(土壤、近地表空氣、植被和其他生物相、水)、生態過程、地形、人類住區和在該系統內運作的基礎建設。」
第一章首先強調土地對人類文明的重要性:「沒有陸域生態系和生物多樣性提供的多種資源、服務和生計體系,我們的個人或社會身份和世界經濟都不會存在。」
報告稱,這在全球經濟的年度價值為75-85兆美元(在2011年根據2007年的美元價值計算),遠遠超過全球GDP的總和。
如SPM提供的下圖說明,目前全球不會結冰的土地中,近四分之三為人所利用。該地區約有12-14%已轉為種植作物(黃色),22%由受管理或人工林組成(藍色),37%是用於放牧和其他用途的草地(綠色)。右側的橙色矩形表示人類當前未使用的土地。
 目前全球陸地表面的使用方式。色塊表示當前(2015年)全球土地使用和管理的程度,分為五大類,包含類別中的不確定範圍。「已用地」指人類定居處、人類管理的草地、林地和農田。「未用地」是指貧瘠的土地、未管理的草生地和林地。資料來源:IPCC土地報告,圖SPM.1c。
報告稱,土地利用的地理分佈以及「大幅佔用多樣的生態系服務和生物多樣性流失」是「人類歷史上前所未見」。人類各種程度的使用,影響約60-85%的森林和70-90%的其他自然生態系(如莽原、天然草原)。報告指出,土地使用導致全球生物多樣性下降11-14%。
人類的土地利用不僅空前普遍,且是在氣候暖化的背景下進行。報告說:
 儀器觀測期間地表氣溫(灰線)和全球平均表面溫度(黑線)的演變。土地溫度為柏克萊、CRUTEM4、GHCNv4和GISTEMP資料集的平均值,顯示為偏離1850-1900的全球平均值。全球溫度為HadCRUT4、NOAAGlobal Temp、GISTEMP和Cowtan&Way資料集的平均值。資料來源:IPCC土地報告,圖SPM.1a。
這種暖化伴隨著降雨模式變化,「改變了生長季節的開始和結束,使區域作物減產,減少淡水供應,並使生物多樣性承受更大壓力和增加樹木死亡率。」
換句話說:氣候變遷正在放大人類施加在土地上的壓力。但是,氣候變遷本身,部分也是人類使用土地的結果。
「自然土地和土地管理的轉變是溫室氣體排放和氣候變遷的主要淨貢獻者,但陸域生態係也是溫室氣體匯。」
「因此,土地不意外地在許多巴黎協定國家自主減排承諾中扮演重要角色。」報告警告,我們能因應全球氣溫上升的時間很短。「可確定的是,機會之窗-可以實現重大變革、將氣候變遷限制在可容忍範圍內的時間-正在迅速縮短。」
由於非永續土地利用與氣候變遷之間密切相關,兩者分別讓各自的問題更難解,報告稱:「加強糧食安全和減少營養不良,同時抑制和扭轉沙漠化和土地劣化,是重大的社會挑戰,同時要適應和減緩氣候變遷影響,又不能犧牲土地的非物質利益,讓這個挑戰更顯艱鉅。」
這也表示,解決一個問題可以同時解決另一個問題,或是必須在兩者間有所取捨。這可能是這份報告的關鍵動機。正如SPM指出:「許多有助於氣候變遷適應和減緩的土地相關措施也可以防治沙漠化和土地劣化,並加強糧食安全。」
但是,第一章指出「這些方案中沒有哪些是互斥的」,這表示將這些方案以適合特定情境的方式整合起來,最有可能經濟有效地「同時達成減緩、調適氣候變遷和解決其他環境挑戰。」
什麼是土地劣化?
新的IPCC報告第四章將土地劣化定義為:
「土地狀態因直接或間接的人為過程呈現負面趨勢,包括人為氣候變遷,表現出長期減少或喪失至少下列之一:生物生產力、生態完整性或對人類的價值。」
該定義包括土壤、植被、水資源或野生動植物質量的暫時或永久性下降,或土地經濟生產力的惡化,例如為商業或生計目的耕作的能力。
表4.1(長達五頁)詳細說明了主要的劣化過程及其與氣候變遷的關係,像是不同類型的侵蝕(逐漸分解和去除岩石和土壤的過程),通常是透過自然力量,例如風、雨或波浪,但可能因耕作、放牧或砍伐森林等活動而加劇。
土壤肥沃度的喪失是另一種劣化形式。可能是由於氮、磷和鉀等營養物質流失,或土壤中有機物含量的下降。其他過程包括:植被類型和覆蓋的減少或變化、土壤的壓實和硬化、野火的增加以及過度開採地下水導致地下水位下降。(該定義僅關注人類直接或間接導致的劣化,不包括火山爆發和海嘯等自然現象。)
報告也指出,森林劣化也是一種土地劣化,只是發生在主要為森林的地區,而「森林砍伐是指森林轉變為非森林,涉及樹木覆蓋的喪失和土地利用的變化」。
報告稱,根據多項證據,全球森林總量從1990年至2015年下降了約3%。然而,近年來對毀林率變化的估計,不同方法產生不同的結果,衛星資料顯示森林損失正在加速,而實地估計則顯示正在減緩。
報告第四章說,森林土地劣化程度的估計也不甚一致。「對森林劣化的不同定義影響了估算森林劣化速度或影響的能力。此外,科學文獻有時會混淆森林劣化和森林砍伐。」
報告指出,所有驅動土地劣化的因素,從暴雨山崩這類短暫而高強度的事件,到長達數個世紀的養分或土壤流失,可形成一個光譜。土地劣化至少從大約1萬至7,500年前的新石器時代就開始,伴隨著人類農業擴張和人口成長發生,其長期性的影響可見一斑。
當然並非所有人類對土地的影響都會導致劣化,報告強調:「全世界有許多長期永續管理土地的例子(如梯田農業系統和永續管理的森林)…我們也承認,人類對土地和生態系的利用為社會提供了必需品和服務。」
巴西亞馬遜雨林空照圖。Neil Palmer/CIAT(CC BY-NC-ND 2.0)
氣候變遷如何影響土地劣化?
「土地劣化與幾個氣候變量密不可分,如溫度、降水、風和季節性,」報告說。這表示氣候變遷和土地劣化有很多相關的形式,報告補充說:
「這種相關更精確地說是一種因果關係網,而不只是一系列的因果關係。」
報告指出,氣候變遷會透過溫度和降雨模式的逐漸變化以及極端事件分佈和強度的變化來影響土地。有時候氣候變遷直接帶給土地劣化過程壓力,它也可能同時是附加於其他大規模人類活動壓力的次要壓力。
氣候變遷扮演「主要的全球性或區域性壓力」的三個過程。分別是「海平面上升導致海岸侵蝕、風暴頻率/強度增加,暖化導致永凍土融化,以及溫度升高和降水變化導致野火增加」。
例如,該報告「高度確信」,由於海平面上升,全球沿海地區的侵蝕將狀況將會惡化:「在多颶風地區(如加勒比海、東南亞和孟加拉灣),海平面上升加更強烈的氣旋,某些地區另外再加上地層下陷,將對人民和生計構成嚴重威脅,有時甚至超出了可適應的範圍。」
氣候變遷「不僅加劇了許多眾所週知的持續性土地劣化過程」,如農田和牧場等人為管理地景,也成為一種主要壓力,帶給自然和半自然生態系新的劣化方式。
暖化和降雨模式改變也將「引發土地和作物管理的變化,例如種植和收穫日期、作物種類和品種類型的變化」,報告指出,「這可能會改變土壤侵蝕的條件」。
報告還指出,「極端天氣和氣候的變化導致區域減產,影響糧食安全」。例如,近幾十年來,由於極端天氣事件,全球平均減少約10%的穀物產量。
氣候變遷已經透過促使遷徙、定居、族群建立和外來種的生態影響,改變外來種所造成的劣化。
當降雨模式發生變化,將導致植被覆蓋和組成改變,「這本身可能就是土地劣化的原因」,「如植被覆蓋本身就是水和風侵蝕造成土壤流失的重要因素」。
氣溫每增加1°C,一般來說空氣濕度可增加約7%。報告稱,這表示氣候暖化可能導致更強烈的降雨,「增加降雨的侵蝕力,進而增加水蝕的機會」。例如在印度中部,1950~2015年間極端降雨事件增加了三倍,這影響了數個土地劣化過程,尤其是土壤侵蝕。
降雨增加和隨之而來的土地劣化可能造成潛在致命後果-山崩機會增加。然而報告指出,雖然理論上極端降雨與這些事件有很強的連結,但目前沒有大量證據顯示氣候變遷與山崩有關。
強降雨和洪水還會「延後種植活動,增加土壤壓實,造成作物損失」,「與熱帶氣旋相關的洪水可導致降雨和暴風雨造成作物歉收」。報告指出,有時這種洪水影響產量的能力比乾旱更強,尤其是在印度等熱帶地區以及中國和歐洲中部和北部等中高緯度地區。
整體而言,某些極端天氣和氣候事件的頻率和強度因全球暖化而增加,並將在中高排放情境下繼續增加。
雨季洪患,對孟加拉的土地來說已是日常。Amir Jina攝(CC BY-NC-ND 2.0)
報告警告,炎熱加乾旱正威脅著已經發生乾旱的地區。「世界大部分地區的熱浪頻率、強度和持續時間會增加,部分已經發生乾旱的地區,乾旱頻率和強度會增加,主要是地中海、中歐、亞馬遜南部和非洲南部。」
報告指出,極端高溫事件會減少樹木的光合作用,限制樹葉的生長速度,影響整棵樹的生長。森林對未來熱壓力的抵抗力會降低,因為極端事件越來越常發生,「乾旱和熱壓力(包括暖冬)可能直接引發局部大量樹木死亡,並且會因蟲害和火災而加劇」。
報告稱,與此相關的是,氣候變遷對野火火勢和人類活動影響越來越大,未來的氣候變化將增加許多生物群落(如熱帶雨林)中野火的風險和嚴重程度。
在未來中高溫室氣體排放量的情境中,全球暖化將加劇熱壓力,使土壤水分更加不足。這將「提高乾旱頻率,導致乾旱加速發生、更強烈和普遍、持續時間更長,可能導致全球乾旱加劇。」
根據報告,氣候變遷導致的地球植被覆蓋變化可能會產生深遠的影響。根據一項研究,如果氣溫比工業化前高出2℃,三分之二的關鍵生物多樣性區域將保持完整,若高出4.5℃則只剩三分之一。在植物減少的地區,由於少了植被防止侵蝕,將發生土地劣化。
下圖來自報告的SPM,說明地表不同方面的風險程度如何隨溫度升高而變化。例如,乾旱地區(最左邊的長條)水資源短缺的風險從目前氣候的「一般」(黃色陰影),暖化2℃會增加到「高」(紅色),3℃會增加到「非常高」(紫色)。
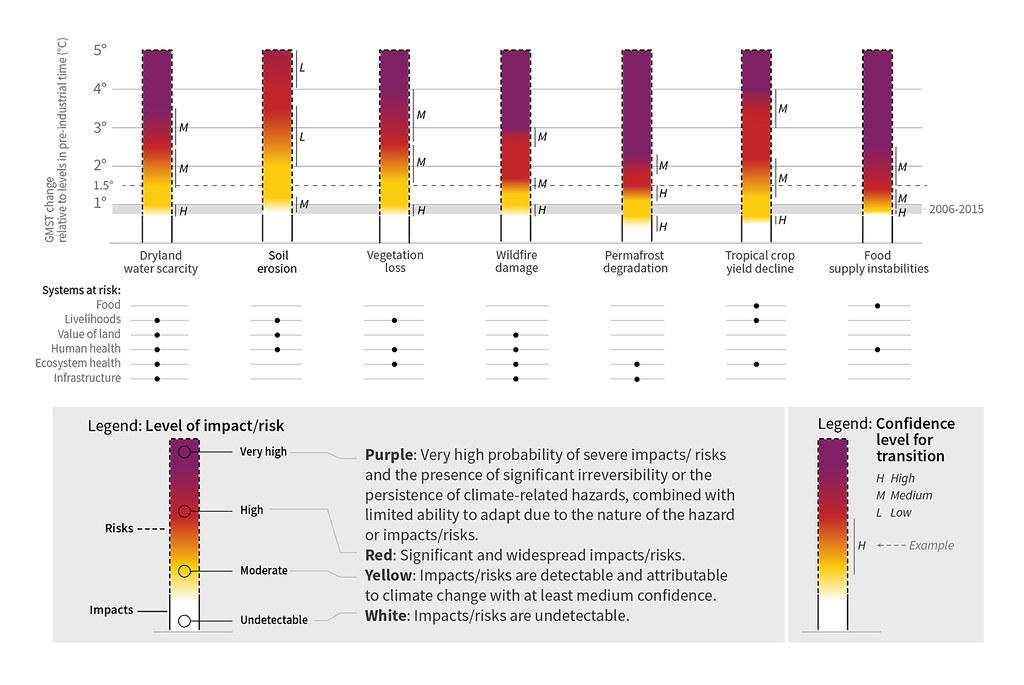 圖表顯示,隨著氣溫升高,永凍土帶來的風險(右邊第三個長條)和糧食供給穩定性風險(最右邊的長條)會迅速增加。
然而,該報告強調氣候變遷某方面可以改善土地狀況。一個例子是「二氧化碳施肥」,即大氣中二氧化碳升高可促進植物生長,「大氣中二氧化碳濃度的增加有助土地改善,只是淨效應受到其他因素的調節,例如氮和水量,。」
然而,正如本週發表的亞馬遜模型研究所顯示,在土壤養分有限的地方,那些有助樹木生長的因素也可能受限。其他益處可能包括高緯度地區生長季節較長,這要歸功於溫暖的春季和秋季的-假設不受夏季乾旱影響的話—而且大氣中二氧化碳含量增加會提高樹木用水的效率。
儘管氣候變遷對土地有一些好處,但報告警告「負面影響仍佔大多數」,這些負面影響已有記錄並且會繼續增加。
報告還研究了土地劣化與人為氣候變遷之間相關的證據。這個研究領域叫做「氣候歸因」,通常適用於極端天氣事件。
要證明氣候變遷明確影響土地劣化「極具挑戰性」,因為劣化是「經常受多種因素影響的複雜現象」,與氣候、生態、土地類型和管理實踐有關。「將土地劣化明確歸因於氣候變遷的研究並不多,但氣候變遷增加土地劣化威脅的研究則不少。」
氣候變遷與土地劣化之間最重要的直接關係是溫度升高、降雨模式變化和降雨加劇。
科學家已經證明,這每一個環節都受到人為溫室氣體的影響。例如,Carbon Brief曾解釋過人類排放和活動如何引起自1950年以來觀測到的近100%的暖化。IPCC 1.5℃特別報告的結論是,人為引起的全球暖化導致全球強降水頻率、強度和/或數量增加。土地報告則指出,人為引起的氣候變遷使水文循環加劇已經得到相當的證實。
根據土地報告的結論,有「高度信心」且有「有力證據」顯示人為氣候變遷引起的降雨變化已經加劇了造成土地劣化的因素,但由於土地管理方法也很重要,將土地劣化歸因於氣候變遷並不容易。
此外,報告也指出:「氣候變遷加劇了大多數劣化過程,很明顯地,除非土地管理得到改善,否則氣候變遷將導致土地劣化加劇。」
土地如何推進氣候變遷?
土地扮演儲存溫室氣體的關鍵角色。根據報告,從2008年到2017年,土地吸收了全世界溫室氣體排放量的30%。
當樹木和其他類型植被進行光合作用時,土地從大氣中吸收二氧化碳。在這個過程中,植物用二氧化碳生成芽、根和葉。這表示只要植物存活,就可以充當長期的碳匯。科學家估計,土地中高達45%的碳是存在全世界的森林中。
土地儲存碳的另一個主要方式是透過土壤,通常經由植物材料、作物殘材和動物糞便獲得碳。全世界地下一公尺深的土壤所含碳量是整個大氣的三倍。
土地吸收溫室氣體的能力,目前正因大氣中二氧化碳濃度增加和較冷環境生長季節變長而增加。
土地雖然是碳的主要儲存處,但也可以排放出溫室氣體。
土地釋出溫室氣體的主要原因是地表的人類活動。報告發現,2007 ~2016年度全球溫室氣體排放量中約有23%來自農業、森林砍伐、泥炭地劣化和其他類型的土地利用。根據報告,二氧化碳釋出的主要因素是森林砍伐和其他類型的植被損失,而甲烷和一氧化二氮排放的主要因素是農業。
下圖來自SPM,顯示自1961年以來三種溫室氣體排放量的變化情況。圖表顯示(1)林業和其他土地利用變化產生的二氧化碳排放量,(2)牲畜甲烷排放(3)農業產生的一氧化二氮排放。
 1961~2018年與1961年相比的溫室氣體排放量。圖表顯示了農業的一氧化二氮排放(1)、牲畜的甲烷排放(2)以及林業和其他土地利用變化的二氧化碳排放(3)。資料來源:改編自IPCC土地報告的圖SPM.1。
該圖表顯示,1960年代土地利用產生的二氧化碳排放量在21世紀穩定維持在「高水平」之前有所下降。從2008年到2017年,土地利用變化產生的二氧化碳排放總量約為每年15億噸。
報告稱,儘管土地利用排放處於「高水平」,但土地仍然是淨碳匯,也就是說土地目前吸收的二氧化碳超過排放的二氧化碳。
這是因為目前人類土地利用產生的排放被土地吸碳所抵銷,如下圖所示(取自第二章第30頁)。
在圖表中,人類活動(農業、林業和其他土地利用,簡稱AFOLU)對土地排放的影響以紅色表示,而自然過程和「間接」人類影響以綠色表示。藍色表示考慮這兩個因素時土地的總排放量。
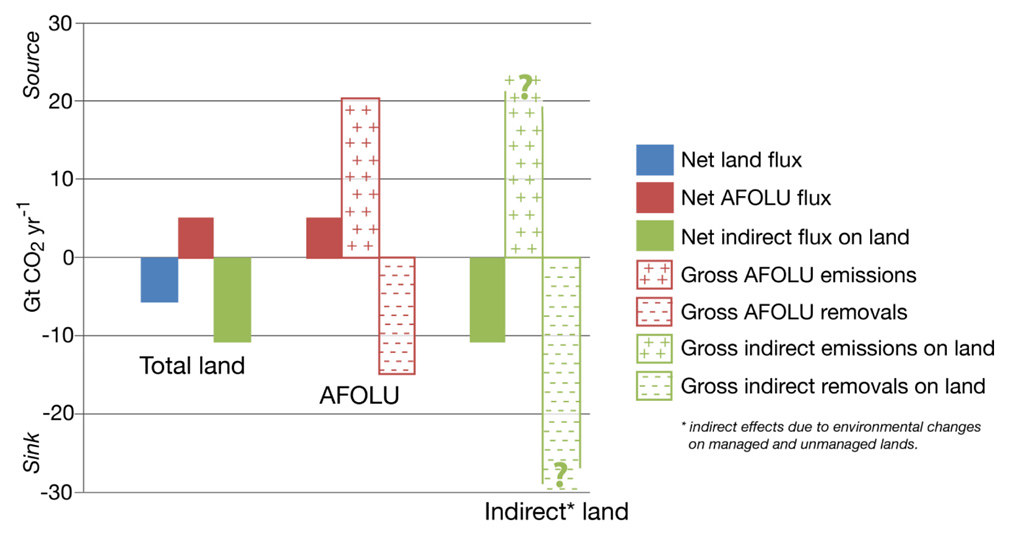 2008~17年土地淨排放量(藍色)、人類活動(AFOLU;紅色)和「間接影響」(綠色)。圖中進一步細分人類活動排放和「間接影響」排放,以顯示兩類二氧化碳排放量和移除量的多寡。資料來源:IPCC土地報告,圖2.4。
根據此圖表,從2007年到2016年,土地的二氧化碳淨移除量平均為每年60億噸(以藍色長條表示)。
進一步細分人類活動排放(AFOLU;紅色加減號)可看出,人類的二氧化碳排放量超過所能夠抵消的。
2007~2016年度最大的土地二氧化碳排放是熱帶森林砍伐。(世界資源研究所的分析發現,過去三年的熱帶森林砍伐比前14年高出63%。)
從圖表也可看出,土地上的人類活動確實可以消除部分二氧化碳排放,主要是重新造林和其他類型的「綠化」,包括農業。
然而,最大的二氧化碳移除量來自「間接影響」(綠色加減號)。這是自然過程,例如由樹木和土壤的作用,以及間接的人為驅動效應,例如二氧化碳施肥效應(在前面更詳細地討論過)。報告指出,這些影響的真實程度仍然有高度不確定性,這就是圖表中畫問號的原因。
報告發現,雖然土地利用產生的二氧化碳排放量已穩定維持在「高水平」,但農業產生的甲烷排放量自1961年以來增加了1.7倍。甲烷這種溫室氣體,在100年的時間內溫室效應比二氧化碳強32倍。
根據SPM,土地甲烷排放的主要來源目前是「反芻動物和水稻種植的擴大」。
反芻動物是具有能夠消化堅韌和纖維材料(例如草)的特殊胃部細菌的動物。動物的消化過程排出甲烷。最常見的反芻畜牧動物是牛和乳牛。
根據報告第二章,目前畜牧業生產佔全球甲烷排放量的33%左右,佔農業甲烷排放的66%。亞洲是畜牧業甲烷排放最多的地區。該地區佔牲畜甲烷排放量的37%,甲烷排放量自2000年以來每年增長約2%。
同時,在水田種植作物會釋放甲烷。水田中的水「缺氧」,導致細菌分解植物質而產生甲烷。稻米甲烷排放佔農業甲烷排放約24%,其中89%的排放來自亞洲。
其他較小的陸地甲烷排放源包括動物糞便、廢棄物燃燒和北半球的泥炭地。北半球泥炭地佔全球甲烷排放量的10%左右。第二章第41頁說:「泥炭地的管理和恢復改變了甲烷與大氣的交換。管理泥炭土一般會將泥炭地從甲烷源轉變為甲烷匯。」
報告稱,自1960年代以來,農業產生的一氧化二氮排放量幾乎翻了一倍。一氧化二氮是一種壽命短暫但強效的溫室氣體,在100年的時間內,一噸一氧化二氮相當於265噸二氧化碳。世界上近三分之二的一氧化二氮排放來自農業。這些排放大部分來自氮肥的應用。自1961年以來,全球作物的肥料用量增加了9倍。(系列專文1/3,)
In-depth Q&A: The IPCC’s special report on climate change and land (1/3) by Carbon Brief
This morning in Geneva, the (IPCC) published its special report on climate change and land.
The land provides the “food, feed, fibre, fuel and freshwater” without which human society and its economy “could not exist”, the report says. This provision is under threat from rising global temperatures and “unprecedented” rates of land and freshwater exploitation in recent decades, the report warns.
The full title of the report gives an indication of the catalogue of interlinked and overlapping issues it covers, including “climate change, desertification, land degradation, sustainable land management, food security, and greenhouse gas fluxes in terrestrial ecosystems”.
In this detailed Q&A, Carbon Brief unpacks what the report says about how climate change affects the land and vice versa, as well as other key topics such as food security, and how to tackle the overlapping challenges associated with how humans use the land.
Why did the IPCC produce this report?
The was published at the end of a week-long approval plenary held in Geneva, Switzerland. At this session, government delegates approved the 43-page “” (SPM) overview report line-by-line, culminating in a . Once the SPM was agreed, the IPCC also released the that runs to nearly 1,400 pages, plus supplementary materials.
(Following the approval of the SPM, there are some updates that need to be made to the full report to ensure it is consistent with the revised SPM. These have not yet been made and so the are subject to changes listed in a .)
The land report was originally commissioned by the IPCC at an April 2016 (pdf). A draft outline for the report was subsequently adopted at a (pdf), in March 2017.
The (pdf) of – selected in July 2017 – is made up of 107 experts from 52 countries. They have been supported by dozens of contributing authors on each chapter.
Tomorrow the will release the —the Special Report on and Land.
The report brings together the most knowledgeable experts and the most reliable science to explore the interlinkages between climate change and land usage.
— IPBES (@IPBES)
Speaking at a press conference this morning, IPCC chair explained what he viewed to be the “high level findings” of this report:
“Land is where we live. Land is under growing human pressure and is part of the solution, but land can not do it all.”
The land report is the second special report that the IPCC is due to publish this year. The second – on – is due in September this year. The IPCC also published a special report on in October 2018.
The aim of these special reports is to provide “”. They complement the main “” that the IPCC publishes every five or six years.
The new report is the first from the IPCC with land as a central focus, since the in 2000.
of the full report sets out what is included in the definition of “land”:
“The terrestrial portion of the biosphere that comprises the natural resources (soil, near surface air, vegetation and other biota, and water), the ecological processes, topography, and human settlements and infrastructure that operate within that system.”
And opens by emphasising the importance of this land to human civilisation:
“Neither our individual or societal identities, nor the world’s economy would exist without the multiple resources, services and livelihood systems provided by land ecosystems and biodiversity.”
The report says these contribute an annual value of $75-85tn to the global economy (in the year 2011, based on the value of the US dollar in 2007), putting it far in excess of the .
As the figure below – from the SPM – illustrates, humans currently appropriate close to three-quarters of the ice-free land globally. Around 12-14% of this area has been converted for growing crops (yellow); 22% is made up of managed or planted forests (blue); and 37% is grassland adopted for grazing and other uses (green). The rectangles in orange on the right-hand side indicate the land currently unused by humans.
A representation of how the global land surface is currently used. The surface tiles show the extent of current (in 2015) global land use and management. They are aggregated into five broad categories and associated uncertainty ranges. “Used land” refers to settlements, managed grassland, forest land and cropland. “Unused land” refers to barren land, unmanaged grassland and forest land. Source: Figure SPM.1c from the .
The geographic spread of land use and the “large appropriation of multiple ecosystem services and the loss of biodiversity” are “unprecedented in human history”, the report says. Human use – at varying intensities – “affects about 60-85% of forests and 70-90% of other natural ecosystems (e.g., savannahs, natural grasslands)”. And land use has caused an 11-14% drop in global biodiversity, the report notes.
Not only is human use of the land more pervasive than ever, it is set against a background of a warming climate. The report says:
Evolution of land surface air temperature (grey line) and global mean surface temperature (black line) over the period of instrumental observations. Land temperatures are taken as an average of the , , and datasets, expressed as departures from global average in 1850-1900. Global temperatures are taken as an average of the , , and datasets. Source: Figure SPM.1a from the .
This warming – along with associated changes in rainfall patterns – has “altered the start and end of growing seasons, contributed to regional crop yield reductions, reduced freshwater availability, and put biodiversity under further stress and increased tree mortality”, the report notes.
In other words: climate change is magnifying the pressures that humans are already putting on the land. But climate change is itself in part a result of the way in which humans use land, the report explains:
“Conversion of natural land, and land management, are significant net contributors to GHG [greenhouse gas] emissions and climate change, but land ecosystems are also a GHG sink.”
“It is not surprising, therefore” the report notes, that the land plays a prominent role in many of the that have been pledged under the .
But time to tackle rising global temperatures is short, the report warns:
“Confidence is very high that the window of opportunity – the period when significant change can be made, for limiting climate change within tolerable boundaries – is rapidly narrowing.”
Because of the close links between unsustainable land use and climate change, solving one is made more difficult by the other, the report says:
“Enhancing food security and reducing malnutrition, whilst also halting and reversing desertification and land degradation, are fundamental societal challenges that are increasingly aggravated by the need to both adapt to and mitigate climate change impacts without compromising the non-material benefits of land.”
This also means that tackling one can have co-benefits – and trade-offs – for the other. This is perhaps the crux of the motivation for the report. As the SPM points out:
“Many land-related responses that contribute to climate change adaptation and mitigation can also combat desertification and land degradation and enhance food security.”
But “none of these response options are mutually exclusive”, says, which means it is working out how to combine them – in a “context-specific manner” – that is most likely to “achieve co-benefits between climate change mitigation, adaptation and other environmental challenges in a cost- effective way”.
What is land degradation?
of the new IPCC report defines land degradation as:
“A negative trend in land condition, caused by direct or indirect human-induced processes including anthropogenic climate change, expressed as long-term reduction or loss of at least one of the following: biological productivity, ecological integrity, or value to humans.”
This definition encompasses temporary or permanent decline in quality of soil, vegetation, water resources or wildlife – or the deterioration of the economic productivity of the land, such as the ability to farm the land for commercial or subsistence purposes.
Table 4.1 – which runs to five pages – details the major degradation processes and their connections with climate change. It includes, for example, different types of erosion – the gradual breaking down and removal of rock and soil. This is typically through some force of nature, such as wind, rain and/or waves, but can be exacerbated by activities including ploughing, grazing or deforestation.
A loss of soil fertility is another form of degradation. This can be through a loss of nutrients, such as nitrogen, phosphorus and potassium, or a decline in the amount of organic matter in the soil. Other processes include: a loss or shift in vegetation type and cover, the compaction and hardening of the soil, an increase in wildfires, and a declining water table through excessive extraction of groundwater.
(This definition solely focuses on degradation driven – either directly or indirectly – by humans, it doesn’t include natural processes such as volcanic eruptions and tsunamis.)
The report also specifies that is land degradation in areas that are still predominantly forest, while “deforestation refers to the conversion of forest to non-forest that involves a loss of tree cover and a change in land use”.
The total amount of forest across the world declined by around 3% from 1990-2015, according to multiple lines of evidence, the reports says.
However, the change in the rate of deforestation in recent years differs between estimates, it adds, with satellite data suggesting that forest loss is accelerating and on-the-ground estimates suggesting that it is slowing down.
There is also little clarity surrounding the extent of land degradation in forests, says of the report. “The lack of a consistent definition of forest degradation also affects the ability to establish estimates of the rates or impacts of forest degradation. Moreover, the [scientific] literature at times confounds [mixes up] estimates of forest degradation and deforestation.”
“The entire spectrum of factors” that drive land degradation range from “very short and intensive events such as individual rain storms of 10 minutes removing topsoil or initiating a gully or a landslide to century scale slow depletion of nutrients or loss of soil particles”, the report says.
The long-term nature of some impacts is reflected in the fact that land degradation has “accompanied humanity at least since the widespread adoption of agriculture during Neolithic time, some 10,000 to 7,500 years ago, and the associated population increase”, the report notes.
But, of course, not all human impacts on land result in degradation, the report stresses:
“There are many examples of long-term sustainably managed land around the world (such as terraced agricultural systems and sustainably managed forests)…We also acknowledge that human use of land and ecosystems provides essential goods and services for society.”
How does climate change affect land degradation?
“Land degradation is inextricably linked to several climate variables, such as temperature, precipitation, wind, and seasonality,” the report says. This means that there are many ways in which climate change and land degradation are related, it adds:
“The linkages are better described as a web of causality than a set of cause-effect relationships.”
Climate change can affect the land through both gradual changes in temperature and rainfall patterns, as well as changes in the “distribution and intensity of extreme events”, the report notes.
There are cases where, even when climate change exerts a direct pressure on degradation processes, “it can be a secondary driver subordinated to other overwhelming human pressures”, the report says. But it identifies three processes in which climate change is the “dominant global or regional pressure”.
These are: “coastal erosion as affected by and increased storm frequency/intensity, responding to warming, and [of wildfires] responding to warming and altered precipitation regimes”.
For example, the report has “very high confidence” that erosion in coastal areas as a result of sea level rise will increase worldwide. It adds:
“In cyclone prone areas (such as the Caribbean, Southeast Asia, and the Bay of Bengal) the combination of sea level rise and more intense cyclones, and in some areas also land subsidence, will pose a serious risk to people and livelihoods, in some cases even exceeding limits to adaption,”
Climate change “not only exacerbates many of the well acknowledged ongoing land degradation processes” of managed landscapes, such as croplands and pasture, but it “becomes a dominant pressure that introduces novel degradation pathways in natural and semi-natural ecosystems”, the report says.
Warming conditions and changing rainfall patterns will also “trigger changes in land- and crop management, such as changes in planting and harvest dates, type of crops, and type of cultivars”, the report notes, “which may alter the conditions for soil erosion”.
The report also notes that “changes in extreme weather and climate have negative impacts on food security through regional reductions of crop yields”. For example, it says that on average over recent decades, around 10% of cereal production has been lost globally because of extreme weather events.
And climate change is already influencing “species invasions and the degradation that they cause by enhancing the transport, colonisation, establishment, and ecological impact of the invasive species”, the report adds.
When rainfall patterns change, it is expected to drive changes in vegetation cover and composition, “which may be a cause of land degradation in and of itself”, the report says, adding: “vegetation cover, for example is a key factor in determining soil loss through both water and wind erosion”.
The air can generally hold around of temperature rise. This means a warmer climate has the potential for more intense rainfall events, which “increase the erosive power of rainfall (erosivity) and hence increase the likelihood of water erosion”, the report says.
For example, in central India,”there has been a threefold increase in widespread extreme rain events during 1950-2015, which has influenced several land degradation processes, not least soil erosion”.
One potentially lethal consequence of increased rainfall and the accompanying land degradation is an uptick in landslides. However, the report notes that while there is “strong theoretical reason” to associate extreme rainfall with these events, there is currently not a lot of evidence linking climate change and landslides.
Heavy rainfall and flooding can also “delay planting, increase soil compaction, and cause crop losses”, the report says, and “flooding associated with tropical cyclones can lead to crop failure from both rainfall and storm surges”. In some cases, this flooding can affect yields more than drought, the report notes – particularly in tropical regions, such as India, and in some mid- and high-latitude regions, such as China and central and northern Europe.
Overall, the report has “high confidence” that the “frequency and intensity of some extreme weather and climate events have increased as a consequence of global warming and will continue to increase under medium and high emission scenarios”.
A combination of heat and drought threatens already drought-prone areas, the report warns:
“Heatwaves are projected to increase in frequency, intensity and duration in most parts of the world and drought frequency and intensity is projected to increase in some regions that are already drought prone, predominantly in the Mediterranean, central Europe, the southern Amazon and southern Africa.”
Extreme heat events can reduce photosynthesis in trees, restrict growth rates of leaves and reduce growth of the whole tree, the report notes. Forests can become less resilient to future heat stress as extreme events occur more often, the report adds, and “widespread regional tree mortality may be triggered directly by drought and heat stress (including warm winters) and exacerbated by insect outbreak and fire”.
On a related note, climate change is “playing an increasing role in determining wildfire regimes alongside human activity”, the report says, “with future climate variability expected to enhance the risk and severity of wildfires in many biomes such as tropical rainforests”.
Under medium and high scenarios of future GHG emissions, “global warming will exacerbate heat stress thereby amplifying deficits in soil moisture”, the report says. This will “increase the rate of drying”, the report adds, “causing drought to set in quicker, become more intense and widespread, last longer and could result in an increased global aridity”.
Changes to the planet’s vegetation cover due to climate change are likely to have , according to the report. According to , if temperatures rise by 2C above pre-industrial levels, two thirds of key biodiversity areas are projected to remain intact, whereas only a third will at 4.5C. In regions where plants decline, land degradation is expected to occur as vegetation provides a vital safeguard against erosion.
The chart below, from the of the report, illustrates how the level of risk to different aspects of the land surface varies with rising temperature. For example, the risk to water scarcity in drylands (left-most bar) increases from “moderate” (yellow shading) in the present climate to “high” (red) in a 2C warmer climate and “very high” (purple) with 3C of warming.
The chart shows that the risks to permafrost (third bar from the right) and food supply stability (right-most bar) are expected to increase particularly rapidly with rising temperatures.
Chart showing the risk of different land system impacts when faced with different levels of temperature rise since pre-industrial times. Source: Figure SPM.2a from the IPCC land report.
The report does, however, stress that some aspects of climate change can improve the condition of the land. One example is “”, where higher levels of CO2 in the atmosphere bolsters plant growth, the report says:
“Increasing CO2 levels in the atmosphere is a driver of land improvement even if the net effect is modulated by other factors, such as the availability of nitrogen and water.”
However, as a indicates, the benefits for tree growth could be restricted where soil nutrients are limited. Other benefits could include longer growing seasons in thanks to warmer shoulder seasons of spring and autumn – assuming they are not affected by summer droughts – and increasing levels of atmospheric CO2 improving how efficiently trees can use water.
Despite some benefits to land as the climate changes, the report warns that “negative impacts dominate”, adding that these have already been documented and “are predicted to increase”.
The report also looks at the evidence for links between land degradation and human-caused climate change – a field of research known as “” that is typically applied to extreme weather events.
Proving a definitive climate change-related influence on land degradation is “extremely challenging”, the report says. This is because degradation is a “complex phenomenon often affected by multiple factors”, related to climate, ecology, land type, and management practices.
“There is not much research on attributing land degradation explicitly to climate change,” the report notes, “but there is more on climate change as a threat multiplier for land degradation”.
The most important direct links between climate change and land degradation are the result of increasing temperatures, changing rainfall patterns, and intensification of rainfall, the report says.
Scientists have shown that each of those links is being affected by human-cause greenhouse gases. , for example, has previously explained how humans emissions and activities have caused around 100% of the warming observed since 1950. And the concluded that human-induced global warming has already caused an increase in the frequency, intensity and/or amount of heavy precipitation events at the global scale. Moreover, “the intensification of the hydrological cycle as a result of human-induced climate change is well established”, the land report says.
The report concludes that there is “high confidence” and “robust evidence” that “rainfall changes attributed to human-induced climate change have already intensified drivers of land degradation, but attributing land degradation to climate change is challenging because of the importance of land management.”
In addition, the report says: “[S]ince climate change exacerbates most degradation processes it is clear that unless land management is improved, climate change will result in increasing land degradation.”
How does the land contribute to climate change?
The land plays a key role in storing greenhouse gases. From 2008-17, the land absorbed 30% of the world’s greenhouse gas emissions, according to the report.
The land takes in CO2 from the atmosphere when trees and other types of vegetation carry out photosynthesis – the process needed for plant growth. In this process, plants use CO2 to build new materials such as shoots, roots and leaves. This means that, as long as plants are alive, they can act as long-term “sinks” of CO2. Scientists estimate that up to of carbon stored in the land is held by the world’s forests.
Another major way that the land holds carbon is through its soils, which typically gain carbon through plant material, crop residues and animal manure. The top metre of the world’s soils is thought to contain as the entire atmosphere.
The report says that the ability of the land to absorb greenhouse gases is currently being aided by “increasing atmospheric CO2 concentration [and] a prolonged growing season in cool environments”. To read more about these issues, please see: “?”
Though the land acts as a major store of carbon, it can also be a greenhouse gas emitter.
The leading cause of greenhouse gas release from the land comes from human activity on its surface. The report finds that around 23% of global greenhouse gas emissions released from 2007-16 came from agriculture, deforestation, degradation and other types of land use.
The major driver of CO2 release is deforestation and other types of vegetation loss, according to the report, whereas the major driver of methane and emissions is agriculture.
The chart below, taken from the SPM, gives a picture of how emissions of all three greenhouse gases have changed since 1961. The chart shows (1) CO2 emissions from forestry and other land-use change, (2) methane emissions from livestock and (3) nitrous oxide emissions from agriculture.
Greenhouse gas emissions from 1961-2018 when compared to 1961 levels. The chart shows: (1) CO2 emissions from forestry and other land-use change; (2) methane emissions from livestock; and (3) nitrous oxide emissions from agriculture. Source: Adapted from figure SPM.1 of the IPCC land report.
The chart shows that CO2 emissions from land use decreased in the 1960s before stabilising at “high levels” in the 21st century. From 2008 to 2017, CO2 emissions from land-use change totalled around 1.5bn tonnes a year, the report says.
Though land-use emissions are at “high levels”, the land is still a net carbon sink, the report says. This means that the land currently takes in more CO2 than it emits.
This is because emissions from human land use are currently being more than offset by land processes that remove CO2 from the atmosphere. An idea of this is given in the chart below, which is taken from page 30 of .
On the chart, the impact of human activity (agriculture, forestry and other land use, AFOLU) on land emissions is shown in red, while the impact of natural processes and “indirect” human influence is shown in green. Blue shows the overall emissions from land when both factors are considered.
Net emissions from the land (blue), human activity (AFOLU; red) and “indirect effects” (green) from 2008-17. The chart shows a further breakdown of human activity emissions and “indirect effect” emissions to show the balance between CO2 emissions and removals for both categories. Source: Figure 2.4 from the .
The chart shows that the “net” removal of CO2 by the land totalled an average of 6bn tonnes a year from 2007-2016. (This is shown by the blue bar.)
A further breakdown of human activity emissions (AFOLU; red pluses and minuses) shows that people are currently causing more CO2 emissions than they are able to offset.
The largest source of CO2 losses from 2007-16 was tropical deforestation, the report says. ( from the found that tropical deforestation in the past three years was 63% higher than in the preceding 14 years.)
Human activity on land does account for some CO2 removal, the chart shows. This is mainly due to reforestation and other types of “” including agriculture, the report says.
However, the largest CO2 removals are carried out by “indirect effects” (green pluses and minuses). These are the natural processes, such as those provided by trees and soils, as well as the “indirect” human-driven effects, such as the CO2 fertilisation effect (discussed in more ). There is still a large degree of uncertainty surrounding the true extent of these effects, the report notes, which is why question marks are included on the chart.
While CO2 emissions from land use have stabilised at “high levels”, methane emissions from agriculture have increased by 1.7 times since 1961, the report finds. Methane is a greenhouse gas that is more potent than CO2 over a 100-year time period.
The major sources of methane emissions from land are currently “ruminants and the expansion of rice cultivation”, according to the SPM.
“” are animals that have specialised stomach bacteria capable of digesting tough and fibrous material such as grass. The digestive process causes the animals to belch out methane. The most commonly reared ruminants are beef and dairy cows.
Livestock production is currently responsible for around 33% of global methane emissions, according to of the report, and for 66% of agricultural methane.
Asia is the region that produces the most methane from livestock production, the report adds. The region accounts for 37% of livestock methane emissions and gases from the region have been growing at about 2% every year since 2000, the report says.
Rice farming, meanwhile, causes methane release when the crop is grown in flooded paddies. In flooded conditions, water can become “” – depleted of oxygen – which causes the bacteria that break down plant matter to .
Rice emissions are responsible for about 24% of agricultural methane emissions – and 89% of emissions come from Asia, the report says.
Other smaller sources of land methane emissions include animal manure, waste burning and peatlands in the northern hemisphere. Northern peatlands contribute around 10% of global methane emissions, says page 41 of :
“Peatland management and restoration alters the exchange of methane with the atmosphere. Management of peat soils typically converts them from methane sources to sinks.”
Nitrous oxide emissions from agriculture have almost doubled since the 1960s, the report says. Nitrous oxide is a short-lived but potent greenhouse gas; one tonne of nitrous oxide is equivalent to over a 100-year time period.
Nearly two-thirds of the world’s nitrous oxide emissions come from agriculture, the report says. Most of these emissions come from the application of nitrogen fertiliser, the report says. Fertiliser application on crops has increased nine-fold worldwide since 1961, it adds.
※ 全文及圖片詳見:()
作者
如果有一件事是重要的,如果能為孩子實現一個願望,那就是人類與大自然和諧共存。
於特有生物研究保育中心服務,小鳥和棲地是主要的研究對象。是龜毛的讀者,認為龜毛是探索世界的美德。
本站聲明:網站內容來源於https://e-info.org.tw/,如有侵權,請聯繫我們,我們將及時處理
【其他文章推薦】
※選購空壓機需注意八大事項 !
※飲用桶裝水到底安不安全? 破解錯誤迷思!
※示波器探測執行效能最佳化的8大秘訣
※買不起高檔茶葉,精緻包裝茶葉罐,也能撐場面!
※各款電動堆高機價格?
※微晶玻璃煎台升溫實驗- YouTube介紹
※貨梯使用安全與保養
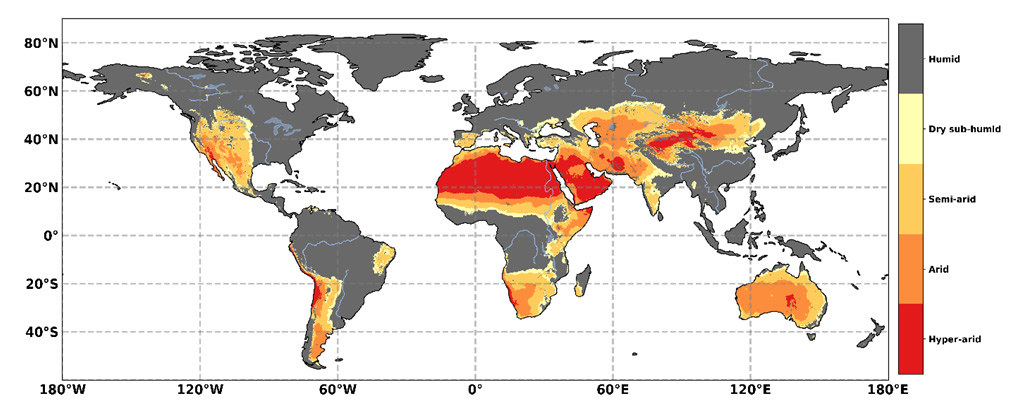
 乾旱地區的地理分佈,以為基礎。AI的分類為:潮濕(灰色陰影)AI> 0.65、乾次濕(黃色)0.50 <AI≤0.65、半乾旱(淺橙色)0.20 <AI≤0.50,乾旱(深橙色)0.05 <AI≤ 0.20、超乾旱(紅色)AI <0.05。資料來源:IPCC土地報告,圖3.1。
 沙漠化影響氣候的主要途徑的。注意:箭頭的顏色表示正(紅色)或負(藍色)效果,或兩者(黑色)。實線箭頭是直接效果,虛線箭頭是間接效果。資料來源:IPCC土地報告,圖3.8。
 報告認為,氣候變遷導致的土地劣化究竟是導致衝突還合作仍然不明。
 薩赫爾地區的乾地,此處位於非洲北部撒哈拉沙漠和中部蘇丹草原地區之間。(CC BY-NC-ND 2.0)
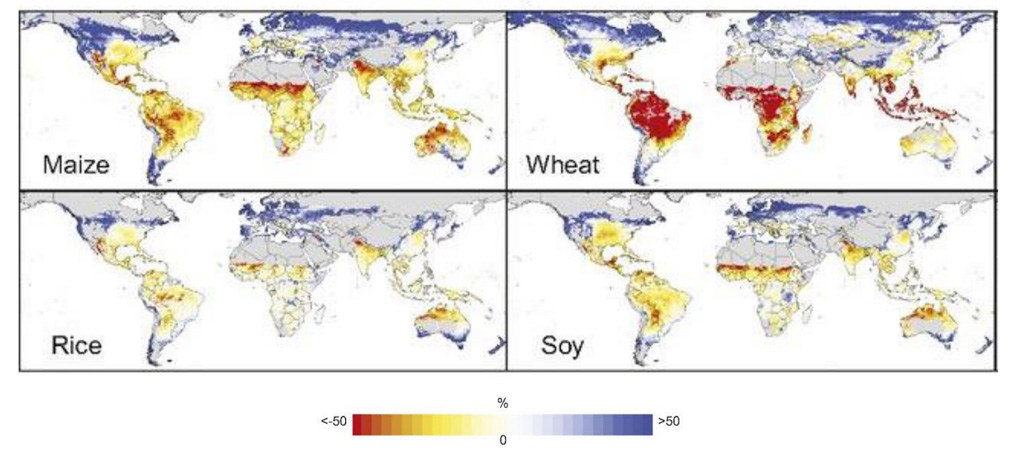 在嚴重氣候變遷情境(RCP8.5)下,2070~2099年間,玉米、小麥、水稻和大豆產量中位數與1980~2010年的比較。紅色表示產量下降50%,藍色表示增加50%,灰色表示未種植作物的區域。資料來源:IPCC土地報告,圖5.4。
 成都的稻田。(CC BY-NC-ND 2.0)
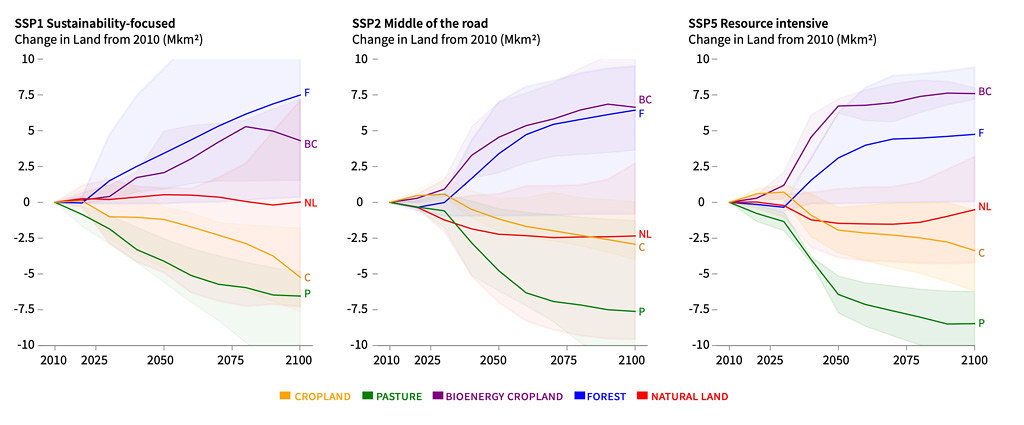 升溫1.5°C的情況下,與2010年相比,用於耕地(黃色)、牧場(綠色)、生質能作物(紫色)、森林(藍色)和自然土地(紅色)的變化。左:SSP1。中間:SSP2,右:SSP5。資料來源:IPCC土地報告,SPM4A圖。
 不同社經途徑(SSP1和SSP3)如何影響氣候相關風險。顏色代表影響/風險水準,紫色表示「非常高」的風險和「顯著的不可逆性」,氣候相關的危害和有限的適應能力,白色表示沒有可偵測到和可歸因於氣候變遷的影響。字母表示調查結果的信心水準(「L」代表低,「M」代表中等,「H」代表高)。資料來源:IPCC土地報告,圖SPM.2B。